Comprehensive 7-Step Electrophysiological Interpretation
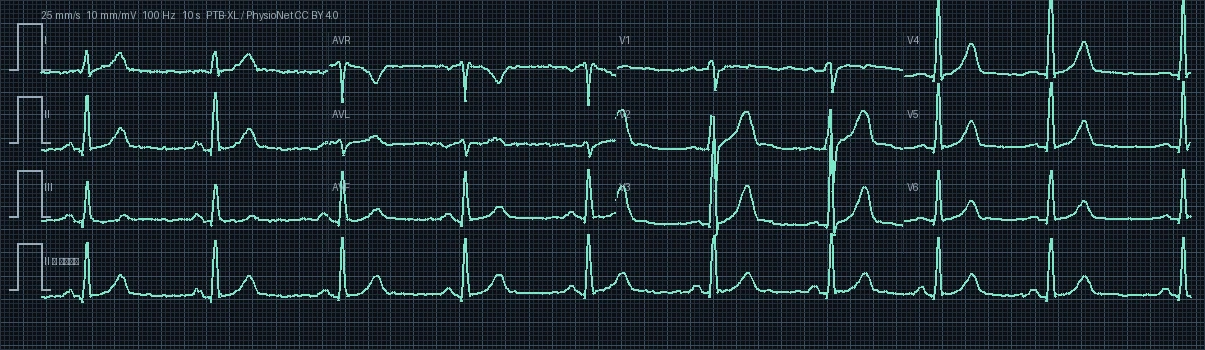
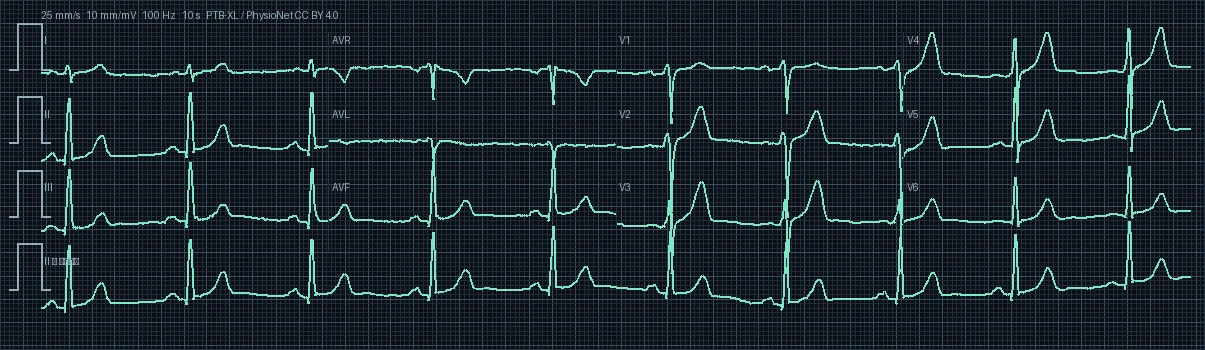
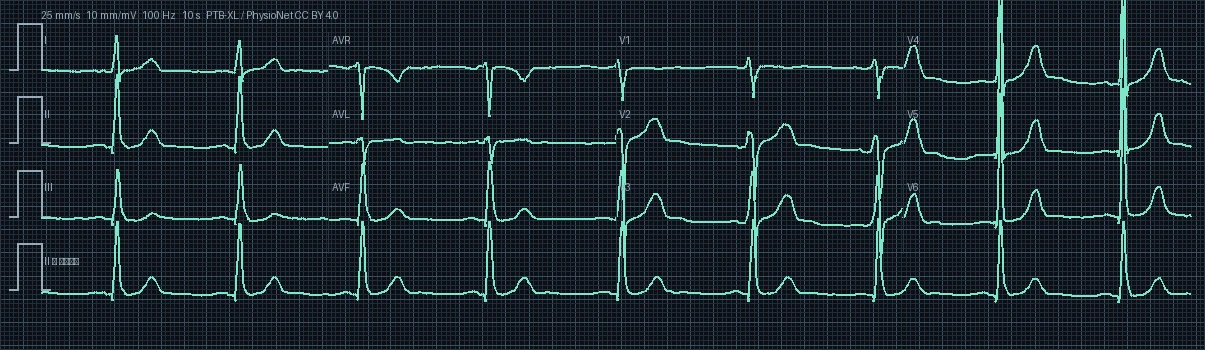
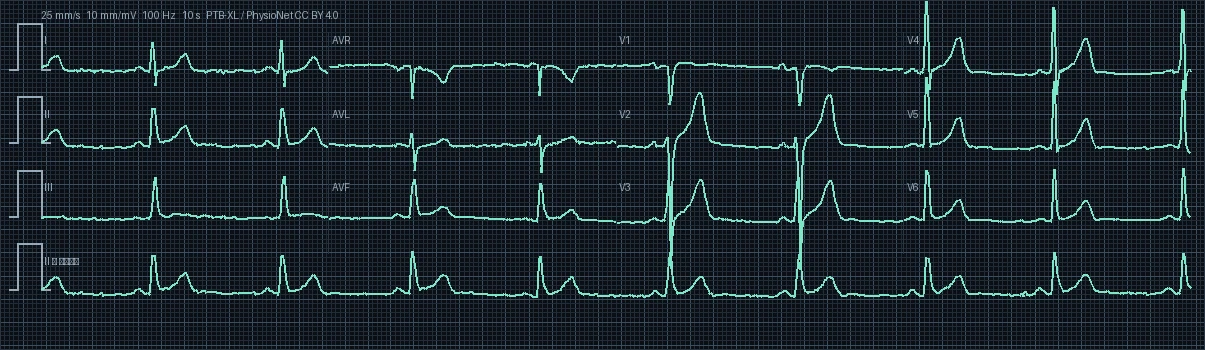
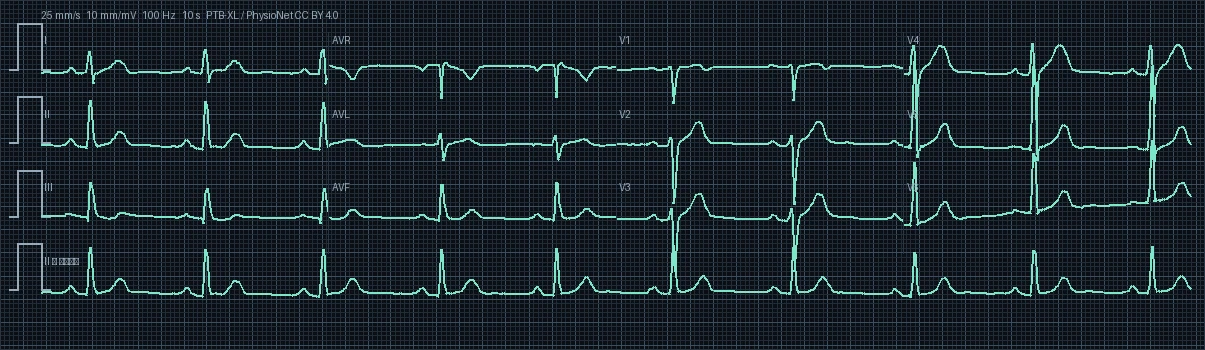
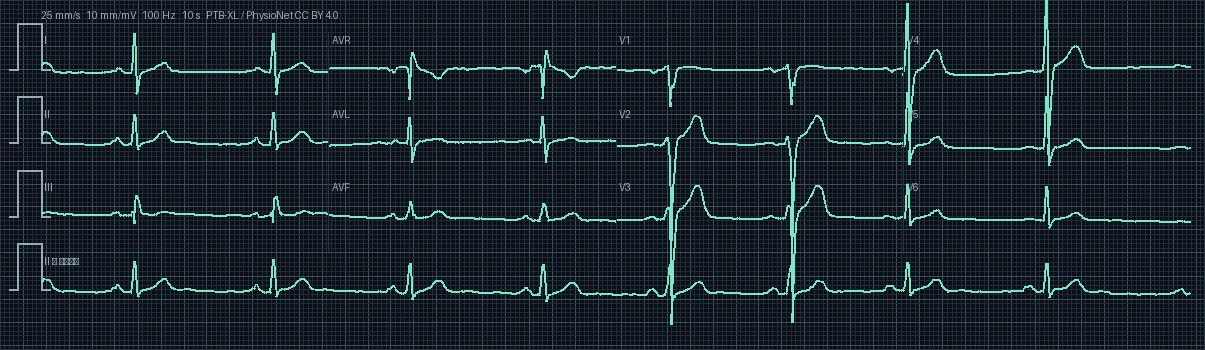
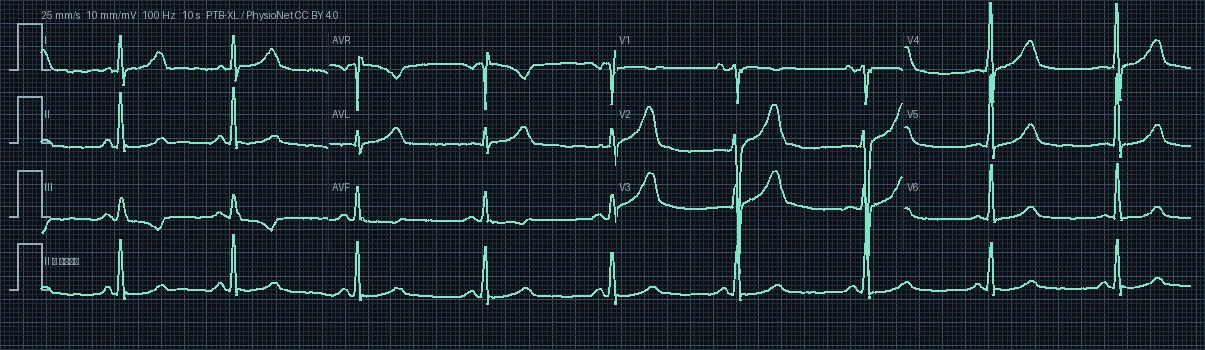
The baseline rhythm is Sinus Bradycardia with intact 1:1 atrioventricular conduction. Electrical depolarization originates physiologically from pacemaker cells in the sinoatrial (SA) node in the superior right atrium, firing at a depressed intrinsic rate modulated by parasympathetic tone. P-wave morphology is uniform and upright in leads II, III, and aVF.
The resting ventricular heart rate is quantified at 56.1 beats per minute (bpm) with a median R-R interval of 1070 ms. This rate is under 60 bpm, categorizing this record as sinus bradycardia, providing prolonged diastolic ventricular filling time.
The mean frontal plane QRS electrical axis is calculated at 84.5° (Normal Axis). The axis falls within the physiologic normal range (-30° to +90°). The mean depolarization vector propagates inferiorly and leftward, reflecting normal left ventricular dominance.
Electrophysiologic interval analysis: PR interval is shortened at 80 ms (<120 ms), raising clinical consideration for ventricular pre-excitation (WPW) or junctional rhythm. QRS complex is narrow at 110 ms (<100 ms), validating rapid, synchronized biventricular activation via the specialized His-Purkinje network. Bazett-corrected QTc (QTc = QT / √RR) is measured at 406.0 ms (raw QT: 420 ms), resting comfortably within safe gender-specific limits for males and confirming stable ventricular repolarization.
P-wave morphology across all 12 leads is unremarkable, without evidence of right or left atrial enlargement. Precordial R-wave progression from lead V1 to V6 is physiological with a normal transition zone at V3-V4. ST segments remain strictly isoelectric throughout, devoid of pathologic elevations or depressions, and T waves exhibit normal upright symmetry concordant with QRS vectors.
Biophysical clinical correlation: In this 41-year-old male patient, electrocardiographic parameters must be framed within adult cardiovascular risk profiles (hypertension, metabolic profile, and lifestyle); intact intervals and isoelectric baselines reflect resting myocardial stability. Furthermore, calculated QTc intervals and resting heart rate closely align with metabolic perfusion demands for this demographic group.
Key differential diagnoses for this normal tracing include: 1. Normal physiologic variant 2. Benign early repolarization variant 3. Transient autonomic fluctuations secondary to anxiety or hyperventilation 4. Subclinical coronary artery disease (normal at rest, requiring stress testing if symptomatic) 5. Minor electrode positioning artifact.