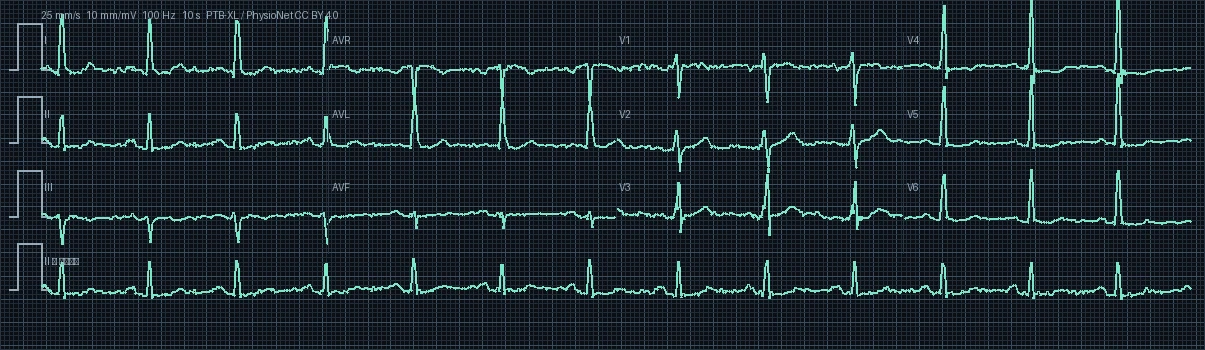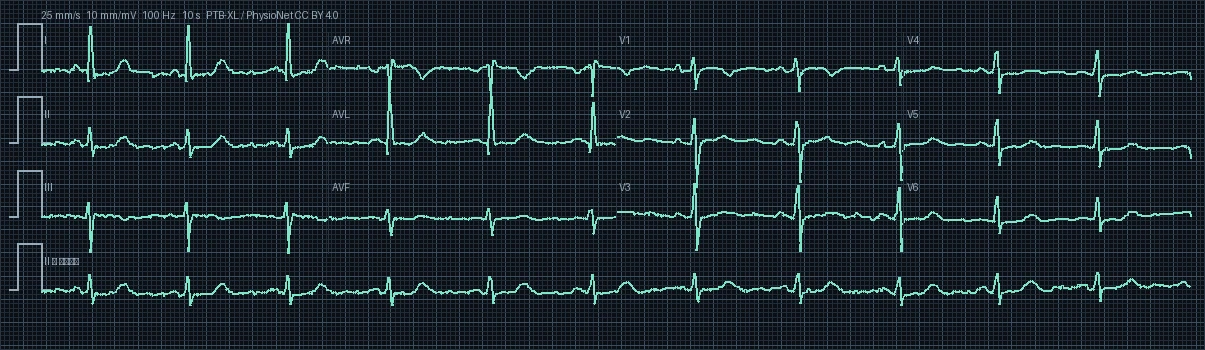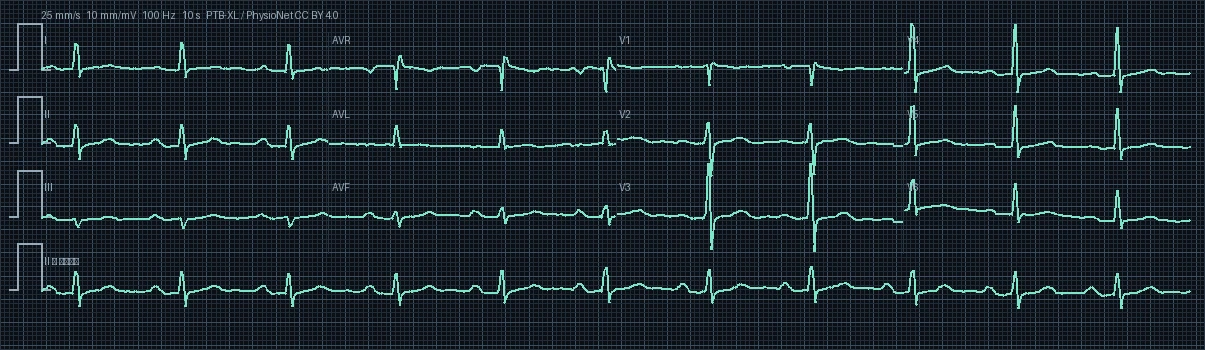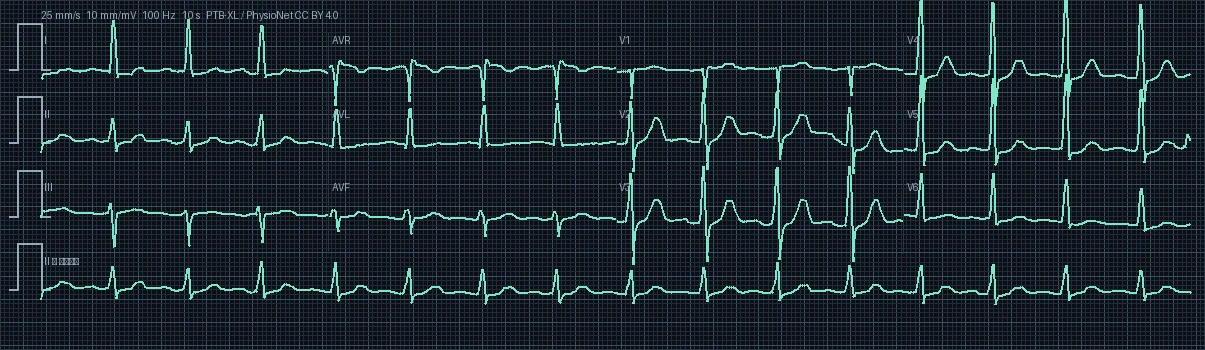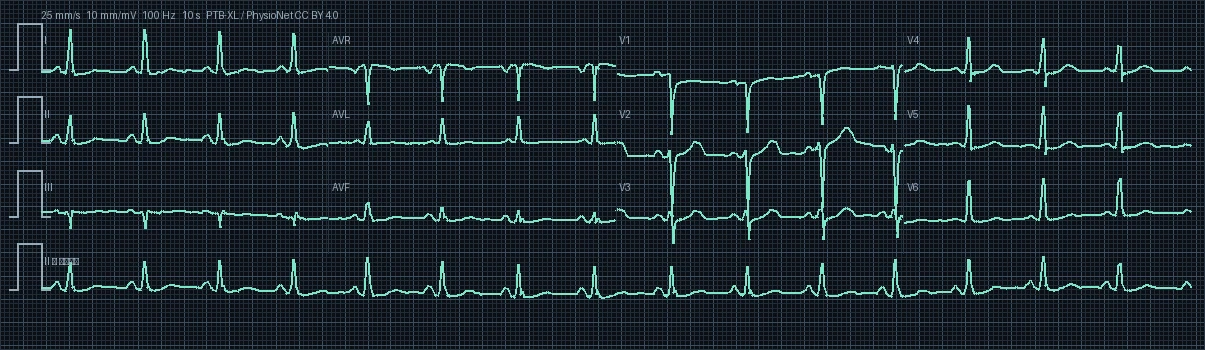
ECG #329 — Non-diagnostic t abnormalities

PTB-XL Record #00329 · 12-Lead Diagnostic Electrocardiogram · 500 Hz High-Resolution

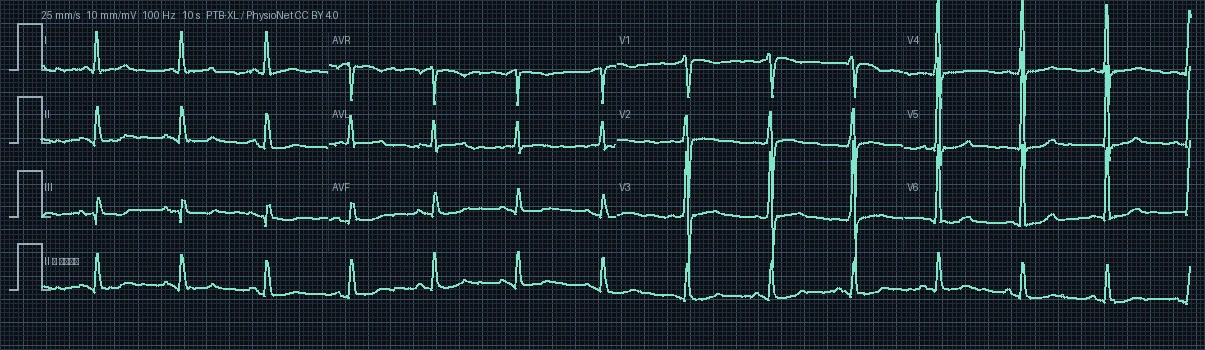
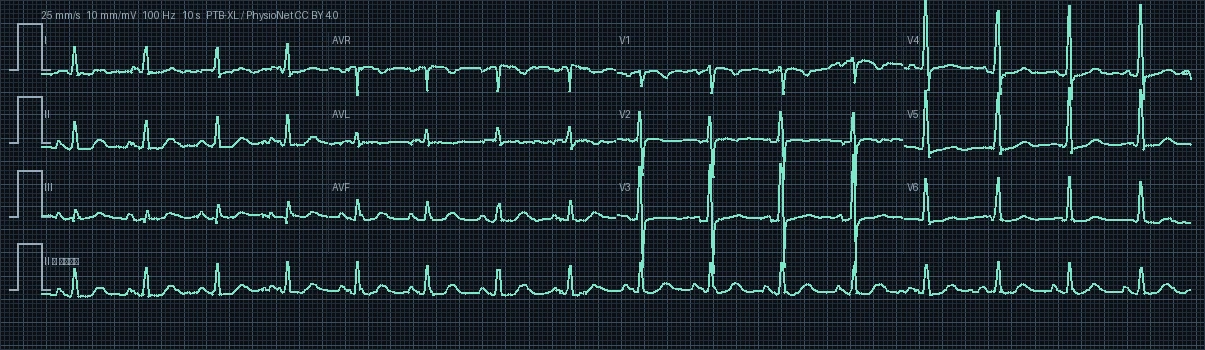
12-Lead Electrocardiogram Preview #329
Target Territory: Full 12-Lead Baseline
I II III aVR aVL aVF V1 V2 V3 V4 V5 V6
Heart Rate
92.3 bpm
PR Interval
110 ms
QRS Duration
90 ms
QTc (Bazett)
409.3 ms
Frontal QRS Axis
+4.6° (Normal)
Demographics
48 yrs · Female

Clinical Direct Answer

The primary diagnostic finding on this 12-lead electrocardiogram is non-diagnostic T abnormalities, recorded with an underlying rhythm of sinus rhythm at a rate of 92.3 beats per minute (normal rate). Pathological waveform alterations are predominantly localized to target territory leads, requiring prompt clinical correlation, serial biomarkers, and targeted electrophysiological evaluation.

Comprehensive 7-Step Electrophysiological Interpretation

1

Rhythm & Pacemaker Origin

The electrocardiogram displays Normal Sinus Rhythm (NSR) with steady regular sequence and intact 1:1 atrioventricular relationship. Cardiac activation initiates normally within the sinoatrial (SA) node in the high posterior right atrium, spreading through the internodal pathways to the AV node. P waves are distinct, uniform, and upright in inferior leads.
2

Ventricular Rate & Regularity

The resting ventricular heart rate is quantified at 92.3 beats per minute (bpm) with a median R-R interval of 650 ms. This rate is within the physiologic normocardia range (60 to 100 bpm), reflecting balanced resting sympathovagal tone and stable cardiac output.

3

Frontal Plane QRS Axis & Vector Analysis

The mean frontal plane QRS electrical axis is calculated at 4.6° (Normal Axis). The axis falls within the physiologic normal range (-30° to +90°). The mean depolarization vector propagates inferiorly and leftward, reflecting normal left ventricular dominance.

4

Conduction Intervals & Chamber Timing (PR, QRS, QT/QTc)

Electrophysiologic interval analysis: PR interval is shortened at 110 ms (<120 ms), raising clinical consideration for ventricular pre-excitation (WPW) or junctional rhythm. QRS complex is narrow at 90 ms (<100 ms), validating rapid, synchronized biventricular activation via the specialized His-Purkinje network. Bazett-corrected QTc (QTc = QT / √RR) is measured at 409.3 ms (raw QT: 330 ms), resting comfortably within safe gender-specific limits for females and confirming stable ventricular repolarization.

5

Waveform Morphology & ST-T Segment Dynamics

ST-segment and T-wave morphology indicates repolarization abnormalities secondary to ischemia (non-diagnostic T abnormalities). Subendocardial ischemia manifests through horizontal or downsloping ST depressions and symmetric T-wave inversions in corresponding territory leads.

6

Clinical Correlation & Pathophysiological Significance

Biophysical clinical correlation: In this 48-year-old female patient, electrocardiographic parameters must be framed within adult cardiovascular risk profiles (hypertension, metabolic profile, and lifestyle); intact intervals and isoelectric baselines reflect resting myocardial stability. Furthermore, calculated QTc intervals and resting heart rate closely align with metabolic perfusion demands for this demographic group.

7

Differential Diagnosis & Recommended Diagnostic Workup

Key differential diagnoses include: 1. Left ventricular strain pattern 2. Digitalis effect (scooped ST depression) 3. Electrolyte derangements such as hypokalemia 4. Acute pulmonary embolism (right ventricular strain) 5. Coronary vasospasm (Prinzmetal angina).

Interactive 12-Lead Signal & Digital Caliper

Select individual leads to examine high-resolution waveforms and measure precise intervals in milliseconds.

Click two points on the tracing to measure interval
Clinical & Educational Notice: This electrocardiogram analysis is generated from the PTB-XL open clinical cohort for educational, reference, and computational research purposes. It does not replace individualized bedside clinical evaluation, emergency triage, or formal cardiologist consultation.