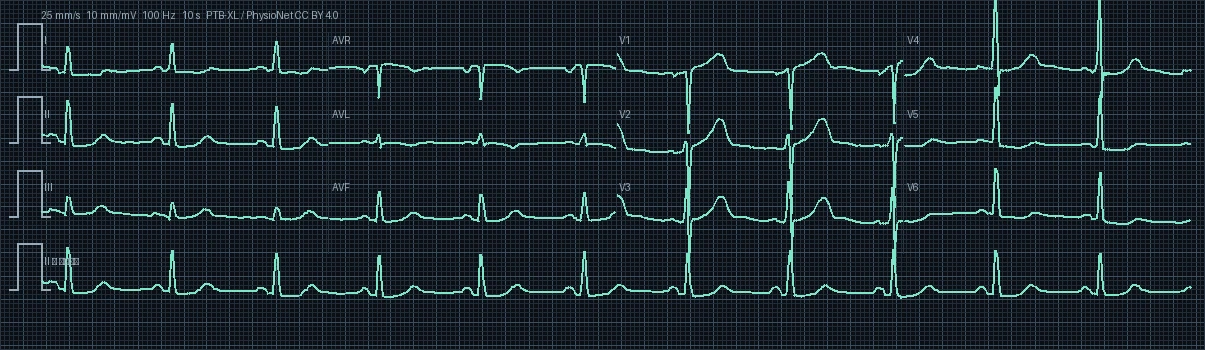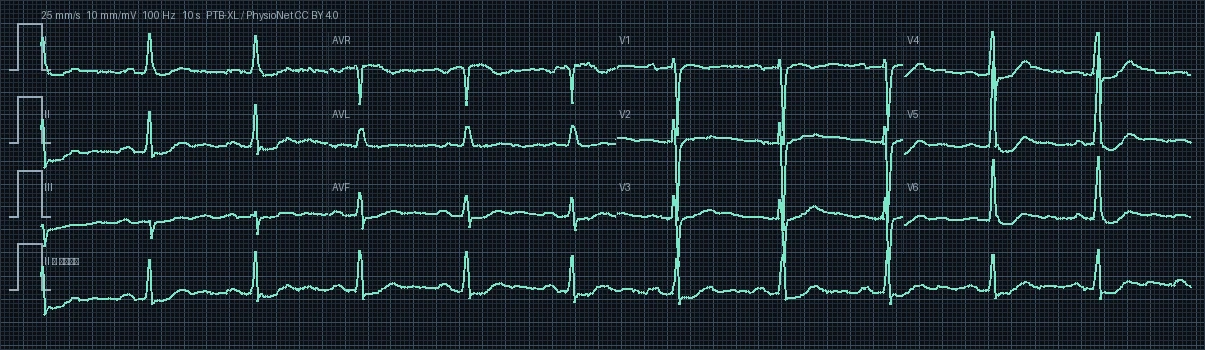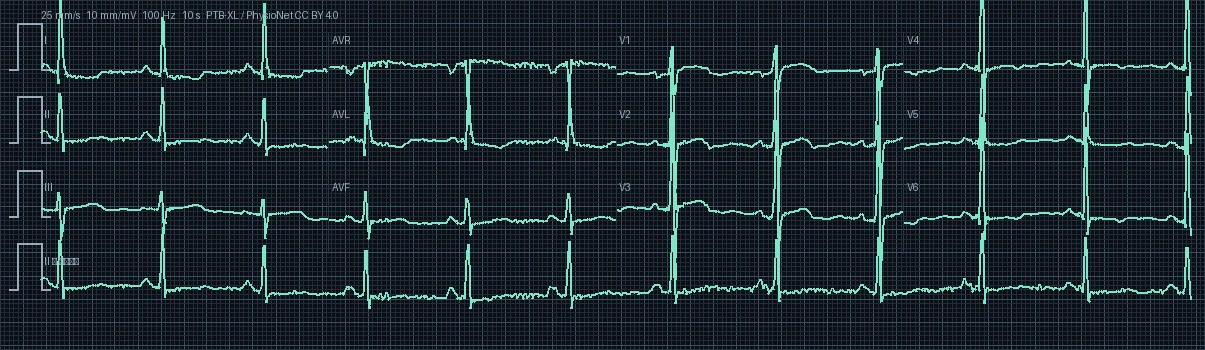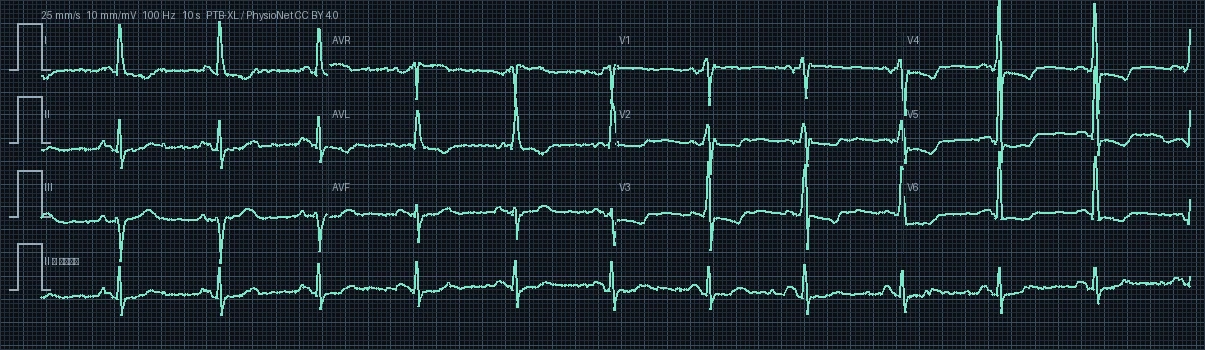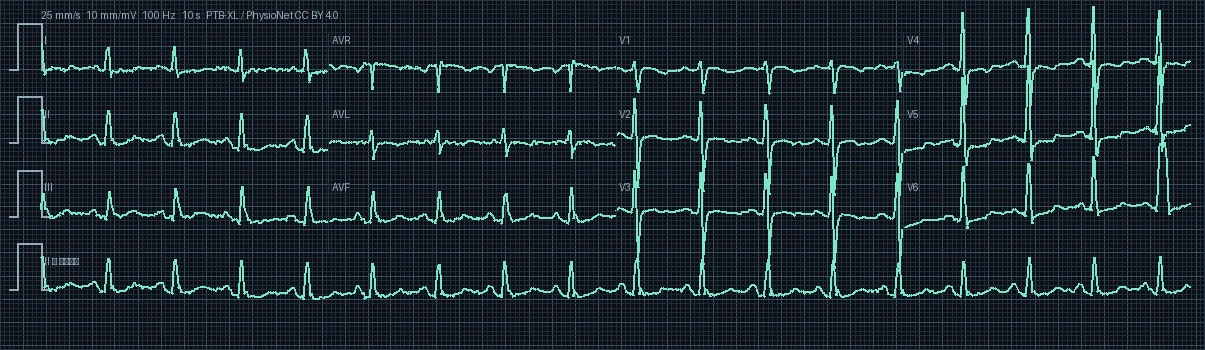
ECG #135 — Ischemic in anterolateral leads

PTB-XL Record #00135 · 12-Lead Diagnostic Electrocardiogram · 500 Hz High-Resolution

12-Lead Electrocardiogram Preview #135
Target Territory: Anterolateral Ischemia
I II III aVR aVL aVF V1 V2 V3 V4 V5 V6
Heart Rate
105.3 bpm
PR Interval
130 ms
QRS Duration
90 ms
QTc (Bazett)
384.1 ms
Frontal QRS Axis
+84.5° (Normal)
Demographics
67 yrs · Female

Clinical Direct Answer

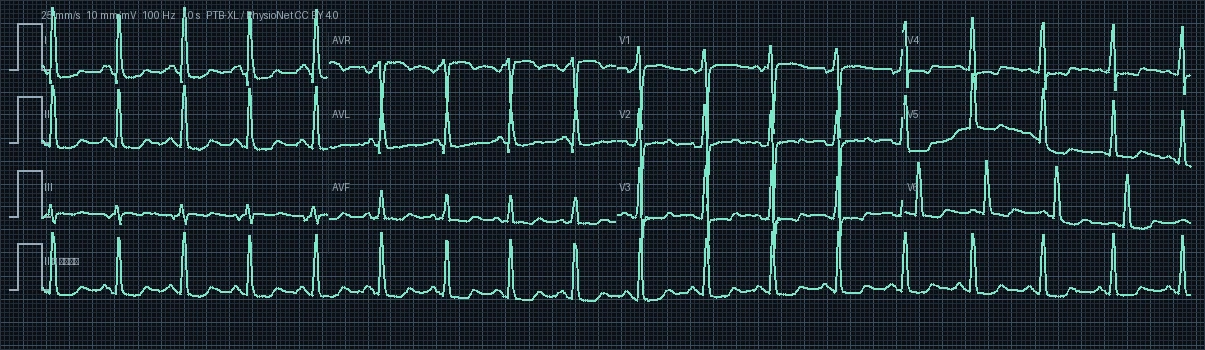
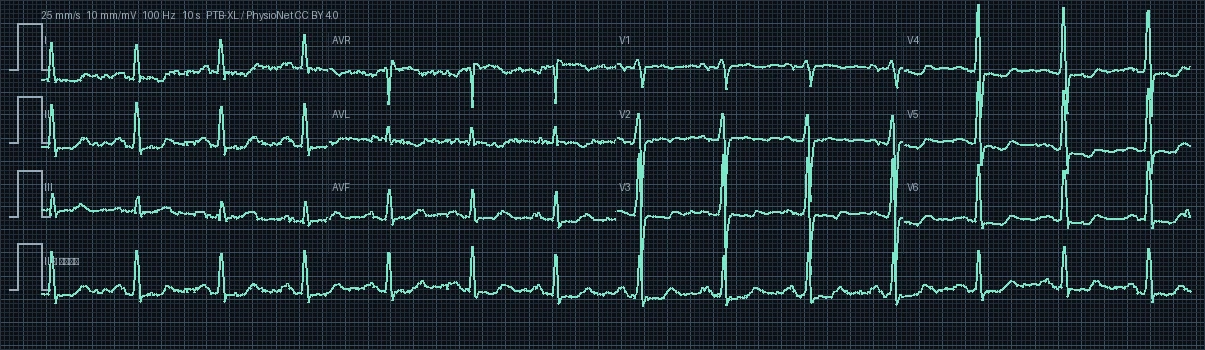
The primary diagnostic finding on this 12-lead electrocardiogram is ischemic in anterolateral leads, recorded with an underlying rhythm of sinus rhythm at a rate of 105.3 beats per minute (tachycardia). Pathological waveform alterations are predominantly localized to target territory leads, requiring prompt clinical correlation, serial biomarkers, and targeted electrophysiological evaluation.

Comprehensive 7-Step Electrophysiological Interpretation

1

Rhythm & Pacemaker Origin

The tracing exhibits Sinus Tachycardia with preserved regular rhythmicity and 1:1 AV association. Impulse formation originates in the sinoatrial node driven by enhanced sympathetic adrenergic tone or physiologic stress. Uniform upright P waves consistently precede each QRS complex.
2

Ventricular Rate & Regularity

The resting ventricular heart rate is quantified at 105.3 beats per minute (bpm) with a median R-R interval of 570 ms. This rate is exceeding 100 bpm, categorizing this record as sinus tachycardia, which attenuates coronary perfusion time during shortened diastole.

3

Frontal Plane QRS Axis & Vector Analysis

The mean frontal plane QRS electrical axis is calculated at 84.5° (Normal Axis). The axis falls within the physiologic normal range (-30° to +90°). The mean depolarization vector propagates inferiorly and leftward, reflecting normal left ventricular dominance.

4

Conduction Intervals & Chamber Timing (PR, QRS, QT/QTc)

Electrophysiologic interval analysis: PR interval is normal at 130 ms (normal range 120-200 ms), confirming physiological transmission velocity across the atrioventricular node. QRS complex is narrow at 90 ms (<100 ms), validating rapid, synchronized biventricular activation via the specialized His-Purkinje network. Bazett-corrected QTc (QTc = QT / √RR) is measured at 384.1 ms (raw QT: 290 ms), resting comfortably within safe gender-specific limits for females and confirming stable ventricular repolarization.

5

Waveform Morphology & ST-T Segment Dynamics

ST-segment and T-wave morphology indicates repolarization abnormalities secondary to ischemia (ischemic in anterolateral leads). Subendocardial ischemia manifests through horizontal or downsloping ST depressions and symmetric T-wave inversions in corresponding territory leads.

6

Clinical Correlation & Pathophysiological Significance

Biophysical clinical correlation: Considering this patient's age of 67 years (female), age-associated degenerative fibrosis of the cardiac skeleton and conduction tissue is common; preserved conduction intervals and absence of advanced AV blocks confirm satisfactory resting conduction system integrity. Furthermore, calculated QTc intervals and resting heart rate closely align with metabolic perfusion demands for this demographic group.

7

Differential Diagnosis & Recommended Diagnostic Workup

Key differential diagnoses include: 1. Left ventricular strain pattern 2. Digitalis effect (scooped ST depression) 3. Electrolyte derangements such as hypokalemia 4. Acute pulmonary embolism (right ventricular strain) 5. Coronary vasospasm (Prinzmetal angina).

Interactive 12-Lead Signal & Digital Caliper

Select individual leads to examine high-resolution waveforms and measure precise intervals in milliseconds.

Click two points on the tracing to measure interval
Clinical & Educational Notice: This electrocardiogram analysis is generated from the PTB-XL open clinical cohort for educational, reference, and computational research purposes. It does not replace individualized bedside clinical evaluation, emergency triage, or formal cardiologist consultation.